Chi-Square Test tests whether the variables in a crosstab are independent based on the observed frequencies. SciPy’s chi2_contingency() can help us quickly calculate chi-square statistic and p-value.
Table of Contents
Contingency Table or Crosstab
A contingency table, also called crosstab, shows the distribution of times between two variables. If you are not familiar with crosstab, you can read the following article first.
The crosstab below is obtained from Women Entrepreneurship and Labor Force.
| European Union Membership Member | European Union Membership Not Member | |
|---|---|---|
| Level of development Developed | 20 | 7 |
| Level of development Developing | 0 | 24 |
Chi-Square Test
Chi-square test verifies whether the observed frequencies are consistent with the expected frequencies. We define the following hypothesis:
- Null hypothesis (H0) : There is no correlation between two variables (independent).
- Alternative hypothesis (H1) : Two variables are dependent.
Next, we will calculate the chi-square value and p-value. Then, use chi-square value or p-value to test whether H0 holds true.
When testing with chi-square value, if chi-square value is less than or equal to the critical value of chi-square, H0 holds true.
When testing with p-value, we will define a significance factor to determine whether there is significant correlation between variables. Generally speaking, this significance factor is taken as 0.05. Therefore, if p-value is greater than or equal to the significance factor, then H0 holds true.
Expected Value Table
The formula for calculating the expected frequencies is:
After adding the total in the above crosstab, it will be like the following table.
| Member | Not Member | Total | |
|---|---|---|---|
| Developed | 20 | 7 | 27 |
| Developing | 0 | 24 | 24 |
| Total | 20 | 31 | 51 |
Using the formula, we can calculate the following expected frequency table.
| Member | Not Member | Total | |
|---|---|---|---|
| Developed | 20 * 27 / 51 = 10.5882 | 31 * 27 / 51 = 16.4117 | 27 |
| Developing | 20 * 24 / 51 = 9.4117 | 31 * 24 / 51 = 14.5882 | 24 |
| Total | 20 | 31 | 51 |
Chi-Square Table
Use the following formula to calculate the chi-square table.
The finally calculated chi-square table is as follows.
| Member | Not Member | |
|---|---|---|
| Developed | (20 – 10.5882)^2 / 10.5882 = 8.3661 | (7 – 16.4117)^2 / 16.4117 = 5.3973 |
| Developing | (0 – 9.4117)^2 / 9.4117 = 9.4117 | (24 – 14.5882)^2 / 14.5882 = 6.0721 |
According to the chi-square table above, we add up all the values in the table to get the chi-square value ().
| Developed, Member | 8.3661 |
| Developing, Member | 9.4117 |
| Developed, Not Member | 5.3973 |
| Developing, Not Member | 6.0721 |
| Chi-Square Value | 29.2472 |
Degree of Freedom
In order to find the critical value of chi-square, we must first calculate the degrees of freedom. The degree of freedom can be calculated using the following formula.
Therefore, the degree of freedom of the above crosstab is (2 – 1) x (2 – 1) = 1.
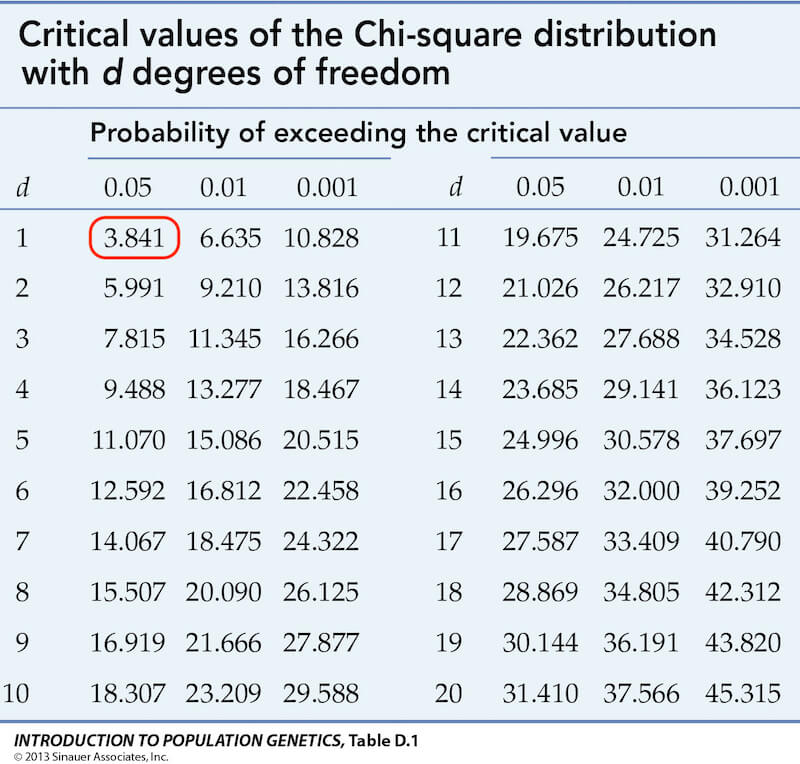
After that, according to the degree of freedom is 1 and the significance factor is 0.05, we find the value is 3.841 in the following table.

If the chi-square value is less than or equal to the critical value of chi-square, then H0 is true. However, our chi-square value is 29.2472 and the critical value is 3.841, so 29.2472 is greater than 3.841. Therefore, H0 is rejected, that is, the two variables are dependent.
P-Value
In addition to using chi-square value to verify H0, you can also use p-value to test. When p-value is greater than or equal to the significance factor, H0 is true. scipy.stats.chi2_contingency() will return a p-value. Generally speaking, the significance factor is 0.05, so if the p-value is greater than or equal to 0.05, H0 is true.
Python SciPy
With SciPy’s chi2_contingency(), we can get all the values described above easily.
chi2, p, dof, expected = scipy.stats.chi2_contingency(observed)
- observed: The observed frequencies, the type is array_like.
- chi2: chi-square value, the type is float.
- p: p-value, the type is float.
- dof: degree of freedom, the type is int.
- expected: The expected frequencies, the type is ndarray. It has the same shape as observed.
Example
The following code shows how to use SciPy’s chi2_contingency() to verify H0. Among them, observed can also be directly filled in the return value of pandas.crosstab().
from scipy.stats import chi2_contingency
observed = [
    [20, 7],
    [0, 24],
]
chi2, p, dof, expected = chi2_contingency(observed)
print('chi-square:', chi2)
print('p-value:', p)
print('degree of freedom:', dof)
print('expected value table:', expected)
if p >= 0.05:
    print('H0 is accepted')
else:
    print('H0 is rejected')
The output is as follows.
chi-square: 29.247311827956988
p-value: 6.370454442050726e-08
degree of freedom: 1
expected value table: [[10.58823529 16.41176471]
 [ 9.41176471 14.58823529]]
H0 is rejected


